
Data fetch, infomation extraction and build web application: all in R!
Several years ago, I created a web page to show the exam scores of schools in Norway on Google Map. The original intention of creating that web page is to help us avoid the area where the schools’ score are low when we want to change our apartment. Recent days, I found many people have intresting of this kind information. So, I created a web-app for that purpose with R. In case somebody want to do the similar work, I wrote the steps how I created the web-app. You can modify some of my codes to create the app you needed.
Step 1: fetch data from internet.
Note, if you have got your data ready, just skip this step.
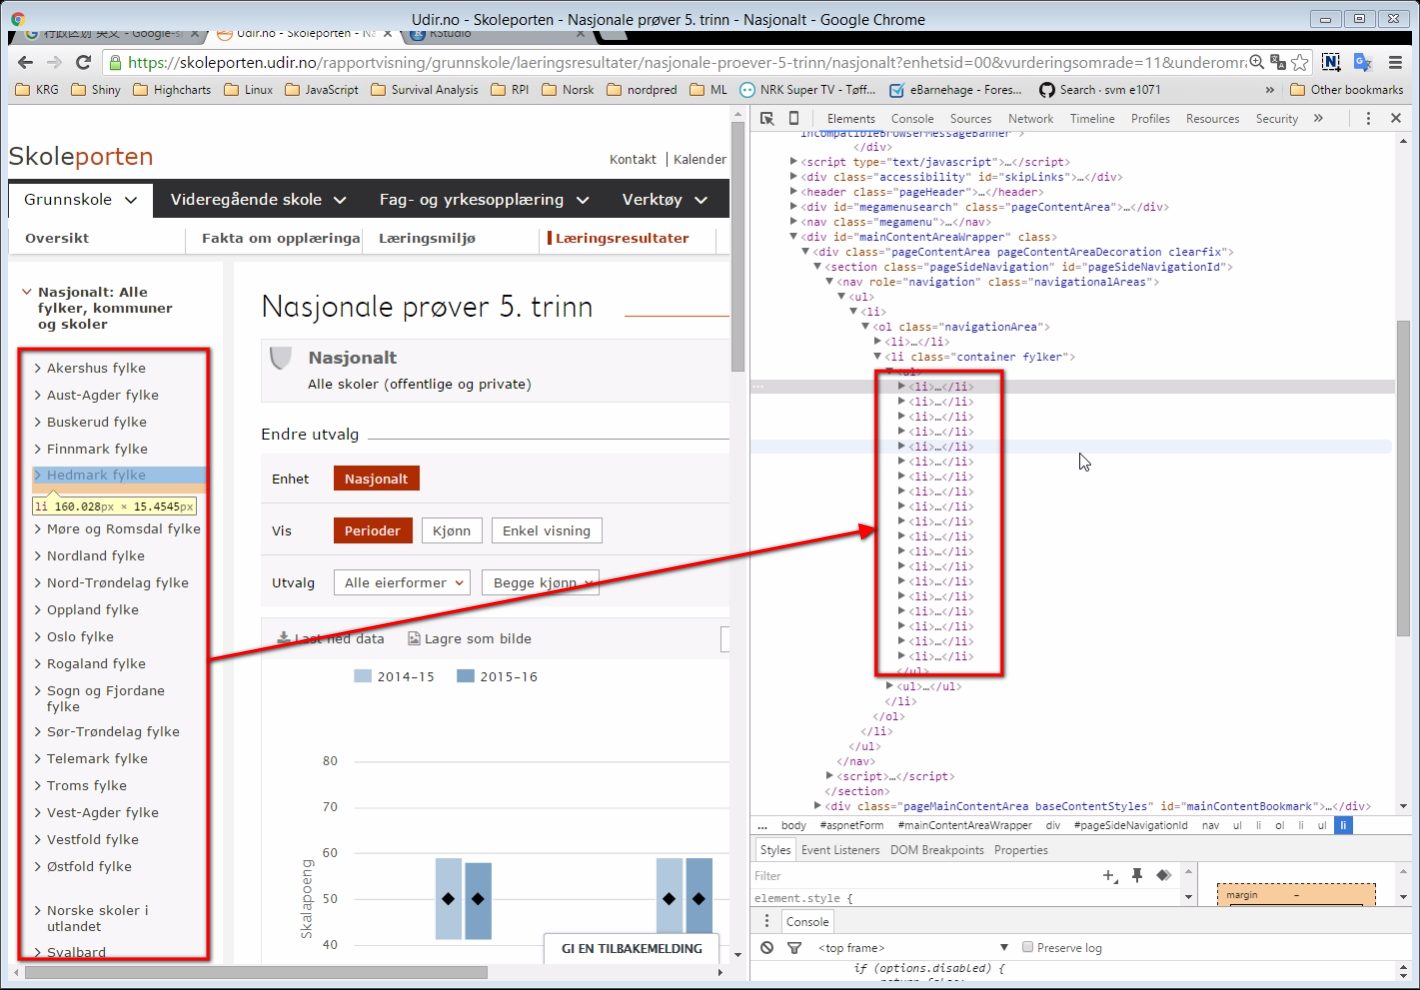
The exam scores data can be found in https://skoleporten.udir.no. We can see there are 4 figures, and what I have interesting is the percentage of the students fall into to level 3 (high) for each subject. There is an option allow you to download the data of the figures mannually, but I don’t want to do that mannually, so I downloaded the source of this page and found the the figure’s data was stored in JSON format. JSON format array can be easily converted into list class of R, which is much easier to mannage for me. The page contains the average scores of whole Norway, and we need to find all schools’ URLs. By inspecting the elements of the page, we can find the there are 19 fylkes (counties), see the following screenshot:
If we click one fylke, we can find some schools inside that fylke, but not all. However, if you inspect the elements of the page again, we can see all the rest schools were also listed, but weren’t shown.
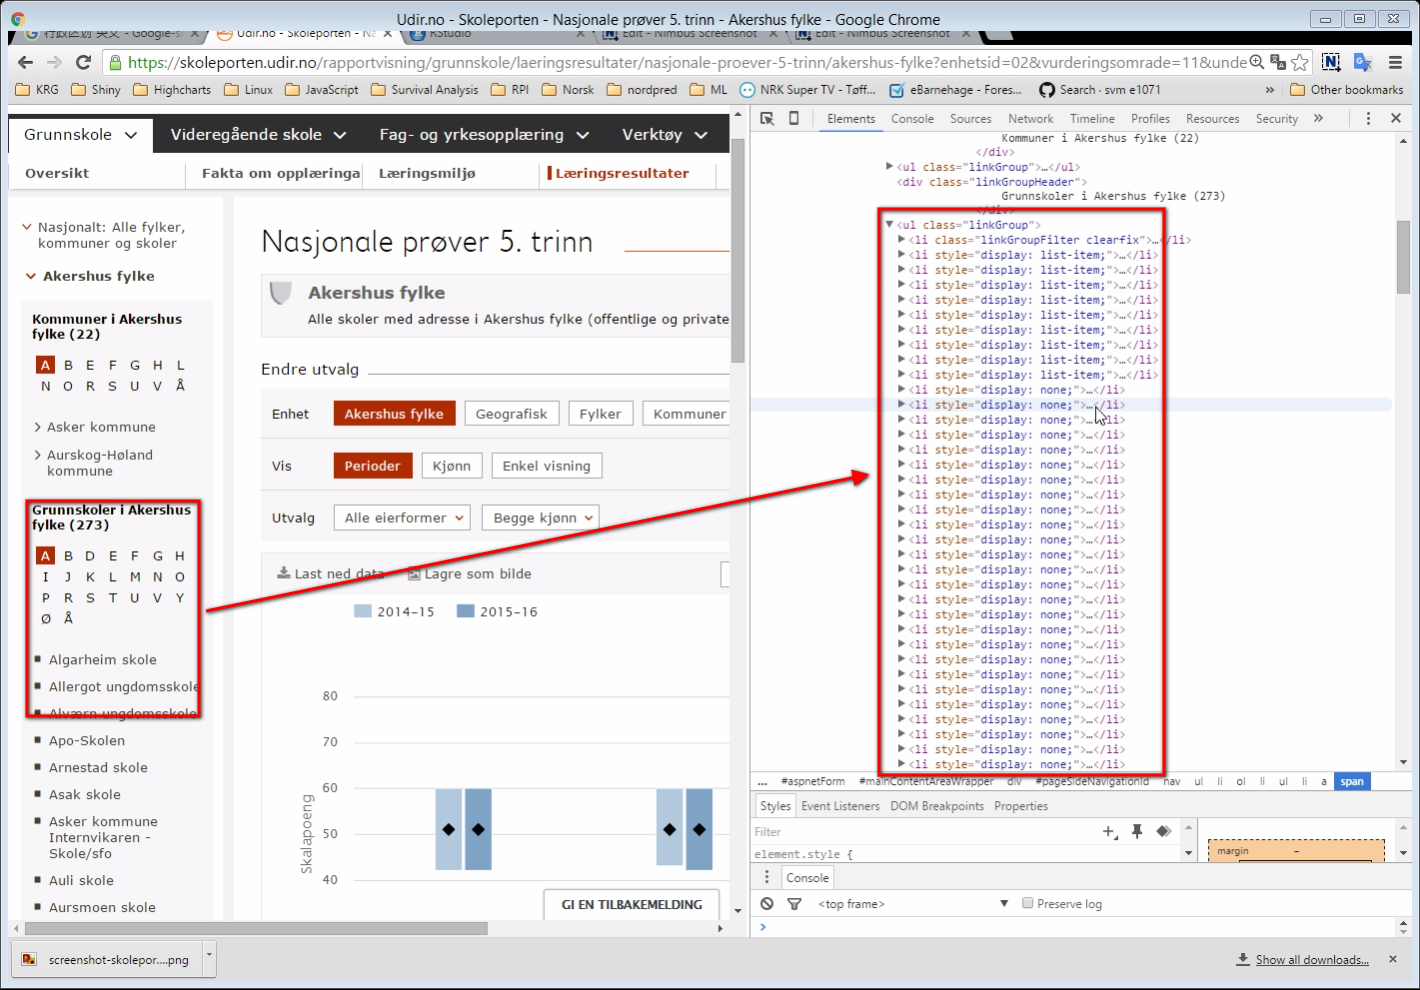
So, we can get all schools’ URLs and download their pages. The following is the R codes for downloading all schools’ pages.
library(XML)
library(RCurl)
library(RJSONIO)

## Fylker ##
udir <- "https://skoleporten.udir.no"
Norge <- "https://skoleporten.udir.no/rapportvisning/grunnskole/laeringsresultater/nasjonale-proever-5-trinn/nasjonalt?enhetsid=00&vurderingsomrade=11&underomrade=50&skoletype=0&skoletypemenuid=0&sammenstilling=1"
HTM <- getURL(Norge)
XML <- htmlParse(HTM, encoding = "UTF-8")
XML <- xpathApply(XML, "//li[@class='container fylker']/ul[1]/li/a[@href]")

n <- 0
for (f in 1:length(XML)) {
  urlF <- xmlAttrs(XML[[f]], "href")[2]
  fylk <- regmatches(urlF, regexec("trinn/(.*?)\\?", urlF))[[1]][2]
  dir_target <- paste("/srv/hd/NasjonalePrøver5/Data/", fylk, sep = "")
  if (!dir.exists(dir_target)) { dir.create(dir_target)}
  htm <- getURL(paste(udir, urlF, sep = ""))
  xml <- htmlParse(htm, encoding = "UTF-8")
  xml <- xpathApply(xml, "//li[@class='container']/ul[@class='linkGroup'][2]/li/a")
  m <- 0
  for (s in 1:length(xml)) {
    url <- paste(udir, xmlAttrs(xml[[s]], "href")[2], sep = "")
    skole <- regmatches(url, regexec("trinn/(.*?)\\?", url))[[1]][2]
    download.file(url = url, destfile = paste(dir_target, "/", skole, ".html", sep = ""), quiet = TRUE)
    n <- n + 1; m <- m + 1
    print(paste(n, m, fylk, skole, sep = ": "))
  }
}
Step 2: Geocoding schools address
The information about each schools contains no geo-coordinates. To show the schools on map we need their longitudes and latitudes. We can match their geo-coordinates through Google Map API. By constructing a URL address contains the schools name, address and “Norway”, we can get the latitude and longtitude of the schools by send a request to Google. The schools names and address inforamtion can extracted using xpath, here is the codes:
setwd("/srv")
file_ls <- list.files(path = "hd/NasjonalePrøver5/Data",recursive = TRUE, full.names = TRUE)
DAT <- data.frame(Fylke = rep(NA, length(file_ls)), Kommuner = NA, Skole = NA, Address = NA)

for (i in 1:length(file_ls)) {
  if (exists("XML")) rm(XML)
  XML <- htmlParse(getURL(file_ls[i], encoding = "UTF-8"))
  xmlSkole <- xpathApply(XML, "//span[@class='enhetsnavn']")
  xmlAddress <- xpathApply(XML, "//div[@class='adressekolonne block']/div/div")
  xmlKommuner <- xpathApply(XML, "//div[@class='skoleeierkolonne block']/div/span[2]")
  skole <- gsub("^ *| *$", "", gsub("\n *|  *", " ", xmlValue(xmlSkole[[1]])))
  address <- gsub("^ *| *$", "", gsub("\n *|  *", " ", paste (xmlValue(xmlAddress[[1]]), xmlValue(xmlAddress[[2]]))))
  kommuner <- gsub(" kommune skoleeier", "", gsub("\n *|  *", " ", xmlValue(xmlKommuner[[1]])))
  fylk <- regmatches(file_ls[i], regexec("Data/(.*?)/", file_ls[i]))[[1]][2]
  DAT$Fylke[i] <- fylk
  DAT$Kommuner[i] <- kommuner
  DAT$Skole[i] <- skole
  DAT$Address[i] <- address
  print(i)
}

## Geocoding
DAT[, c("Lon", "Lat")] <- NA
googleMap <- "http://maps.googleapis.com/maps/api/geocode/xml?sensor=false&address="
for (i in 1:nrow(DAT)) {
  url <- paste(googleMap, paste(paste(DAT$Address[i], DAT$Skole[i], DAT$Kommuner[i], sep= " "), "Norway", sep = " "), sep = "")
  url <- gsub(" ", "%20", url)
  if (exists("xml")) {rm(xml)}
  xml <- getURL(url); Sys.sleep(.5)
  if (exists("xml")) {
    DAT[i, 'Lon'] <- as.numeric(regmatches(xml, regexec("<lng>(.+?)</lng>", xml))[[1]][2])
    DAT[i, 'Lat'] <- as.numeric(regmatches(xml, regexec("<lat>(.+?)</lat>", xml))[[1]][2])
    print(i)
  }
}

save(DAT, file = "hd/NasjonalePrøver5/Data/SkoleGeo.RData")
Step 3: Information extraction.
This step acctually can be included into above step. However, geocoding may take longer time, and Google has a limited number of request, so, it’s better do it seperately.
Scores information stored in figures, and figure’s data stored as JavaScript array. Using regular expression may extract the information needed, but it’s much easier if we convert JavaScript array into list class of R. See the codes below:
setwd("/srv")
file_ls <- list.files(path = "hd/NasjonalePrøver5/Data", pattern = ".html", recursive = TRUE, full.names = TRUE)
load("hd/NasjonalePrøver5/Data/SkoleGeo.RData")

DAT$Engelsk2014 <- DAT$Engelsk2015 <-
DAT$Lesing2014  <- DAT$Lesing2015 <-
DAT$Regning2014 <- DAT$Regning2015 <- NA

for (i in 1:length(file_ls)) {
  if (exists("XML")) rm(XML)
  ## htmlParse(getURL("hd/NasjonalePrøver5/Data/akershus-fylke/algarheim-skole.html"), encoding = "UTF-8")
  XML <- htmlParse(getURL(file_ls[i], encoding = "UTF-8"))

  ## Figure data
  xmlScript <- xpathApply(XML, "//script[contains(., 'showDiagram')]")
  if (length(xmlScript) == 4) {
    ## 2 Engelsk
    xmlEngelsk <- gsub("^.*?, '|',.*$", "", gsub("\\", "", xmlValue(xmlScript[[2]]), fixed = TRUE))
    if (grepl("chartType", xmlEngelsk)) {
      jsonEngelsk <- fromJSON(xmlEngelsk)
      for (n in 1: length(jsonEngelsk$categories)) {
        id <- jsonEngelsk$categories[[n]]$id
        if (id == "2014-2015") {
          v1 <- jsonEngelsk$series[[1]]$data[[n]]$verdi
          if (!is.null(v1)) {DAT$Engelsk14[i] <- v1}
        }
        if (id == "2015-2016") {
          v2 <- jsonEngelsk$series[[1]]$data[[n]]$verdi
          if (!is.null(v2)) {DAT$Engelsk15[i] <- v2}
        }
      }
    }

    ## 3 Lesing
    xmlLesing <- gsub("^.*?, '|',.*$", "", gsub("\\", "", xmlValue(xmlScript[[3]]), fixed = TRUE))
    if (grepl("chartType", xmlLesing)) {
      jsonLesing <- fromJSON(xmlLesing)
      for (n in 1: length(jsonLesing$categories)) {
        id <- jsonLesing$categories[[n]]$id
        if (id == "2014-2015") {
          v1 <- jsonLesing$series[[1]]$data[[n]]$verdi
          if (!is.null(v1)) {DAT$Lesing14[i] <- v1}
        }
        if (id == "2015-2016") {
          v2 <- jsonLesing$series[[1]]$data[[n]]$verdi
          if (!is.null(v2)) {DAT$Lesing15[i] <- v2}
        }
      }

    }

    ## 4 Regning
    xmlRegning <- gsub("^.*?, '|',.*$", "", gsub("\\", "", xmlValue(xmlScript[[4]]), fixed = TRUE))
    if (grepl("chartType", xmlRegning)) {
      jsonRegning <- fromJSON(xmlRegning)
      for (n in 1: length(jsonRegning$categories)) {
        id <- jsonRegning$categories[[n]]$id
        if (id == "2014-2015") {
          v1 <- jsonRegning$series[[1]]$data[[n]]$verdi
          if (!is.null(v1)) {DAT$Regning14[i] <- v1}
        }
        if (id == "2015-2016") {
          v2 <- jsonRegning$series[[1]]$data[[n]]$verdi
          if (!is.null(v2)) {DAT$Regning15[i] <- v2}
        }
      }
    }
  }
  print(i)
}
save(DAT, file = "hd/NasjonalePrøver5/Data/DAT.RData")
Step 4: create a web-app for interactively display and quire.
I will not present all files needed for creating a Shiny web-app, because even I post them all here, you may still can’t make the web-app run. But you can get all files on my gist.
ui.R
library(rCharts)
shinyUI(bootstrapPage(
  # Add custom CSS & Javascript;
  tagList(
    tags$head(
      tags$style("hr {margin: 5px 0;}"),
      tags$script(src="jquery-ui.js"),
      tags$script(src="app.js"),
      tags$link(rel="stylesheet", type="text/css",href="style.css")
    )
  ),
  img(id = "control", src = "control.png"),
  div(class = "Input",
      HTML("<div class='drag'></div>"),
      uiOutput("uiFylke"),
      uiOutput("uiYear"),
      uiOutput("uiSubject"),
      uiOutput("uiChart"),
      HTML("<hr></hr>"),
      uiOutput("uiLegend"),
      textInput(inputId = "log", label = "")),
  div(class = "control",
      uiOutput("uiMapType")),
  div(class = "Output",
      HTML("<div class='drag'></div>"),
      showOutput("fig", lib = "highcharts")),
  showOutput("myMap", "leaflet")
))
server.R
load("Data/DAT.RData")
shinyServer(function(input, output, session) {
  p <- reactiveValues()
  observe({
      msg <- gsub(".*ipInfo", paste(date(), "ipInfo"), input$log)
      if (nchar(msg) > 20) {
        write(msg, "www/visitors.txt", append  = TRUE)
      }
  })
  ## Source input and output;
  source("RScript/input.R",  local = TRUE)
  source("RScript/jsFun.R", local = TRUE)
  source("RScript/output.R", local = TRUE)
})
output.R
observe({
  if (!is.null(input$chart)) {
    if (input$chart) {
      output$fig <- renderChart({
        ## Highchart basic;
        H <- Highcharts$new()
        H$addParams(dom = "fig")
        H$chart(type = "column", zoomType = "xy", width=1000, height = 600, spacingTop = 10, inverted = TRUE)
        H$subtitle(text = " ", style = list(fontSize = "14px", color = "black"))
        H$exporting(enabled = TRUE)
        H$legend(enabled = FALSE)
        H$data(p$dat$score)
        H$xAxis(tickLength = 0,
                categories = p$dat$Skole,
                title      = list(text = "Skole"))
        H
      })
    }
  }
})

observe({
  if (!is.null(input$fylke)) {
    output$myMap <- renderMap({
      m <- Leaflet$new()
      m$addParams(width="100%", height=1000, layerOpts = list(maxZoom = 18))
      if (input$mapType == "openstreet") {
        m$addParams(urlTemplate= 'http://{s}.tile.openstreetmap.de/tiles/osmde/{z}/{x}/{y}.png')
      } else if (input$mapType == "statllite") {
        m$addParams(urlTemplate= 'http://server.arcgisonline.com/ArcGIS/rest/services/World_Imagery/MapServer/tile/{z}/{y}/{x}')
      } else if (input$mapType == "opencycle") {
        m$addParams(urlTemplate= 'http://{s}.tile3.opencyclemap.org/landscape/{z}/{x}/{y}.png')
      }
      ## Fylke
      dat <- DAT[which(DAT$Fylke %in% input$fylke), ]
      ## Year
      id <- 1:6
      for (yr in input$year) {
          id <- c(id, grep(yr, names(dat)))
      }
      dat <- dat[, id]
      ## Subject
      id <- 1:6
      for (s in input$subject) {
        id <- c(id, grep(s, names(dat)))
      }
      dat <- dat[, id]
      if (is.data.frame(dat[, -c(1:6)]) ) {
        dat$score <- round(rowMeans(dat[, -c(1:6)], na.rm = TRUE),1)
      } else {
        dat$score <- dat[, -c(1:6)]
      }
      dat <- dat[which(!is.na(dat$Lon) & !is.na(dat$Lat) & !is.na(dat$score)), ]
      print(dat)
      lon <- mean(dat$Lon)
      lat <- mean(dat$Lat)
      m$addParams(bounds = list(c(lat-.1,lon-.1), c(lat+.1,lon+.1)))
      ## Build GeoJSON list;
      Dat <- list()
      scoreUni <- sort(unique(round(dat$score)))
      color_ls <-   colorRampPalette(c("#00007F", "blue", "#007FFF", "cyan", "#7FFF7F", "yellow", "#FF7F00", "red", "#7F0000"))(length(scoreUni))
      for (i in 1:nrow(dat)) {
        geoList <- list(type = "Feature",
                        geometry = list(type = "Point", coordinates = c(dat$Lon[i], dat$Lat[i])),
                        properties = list(color = "black",
                                          fillColor = color_ls[which(scoreUni == round(dat$score[i]))],
                                          fillOpacity = .8,
                                          radius = 10*dat$score[i]/100 + 3,
                                          popup = paste(paste(c("School", "Address", "Score"), dat[i, c("Skole", "Address", "score")], sep = ": "), collapse = "<br>")
                        ))
        Dat[[length(Dat)+1L]] <- geoList
      }
      p$dat <- dat[rev(order(dat$score)), ]
      p$scoreUni <- scoreUni
      p$color_ls <- color_ls
      m$geoJson(Dat, onEachFeature = jsOnEachFeature,
                style = jsStyle, pointToLayer =jsPointToLayer)
      m
    })
  }
})
I hope this post can help you to build some simple web application.