
Read PowerPoint shape figure into R.
Unarguably, PowerPoint is still the most widely used presentation tool. And I do admit that PowerPoint is good at many tasks, such like drawing any kind of shapes. But, we all know “point-and-click” is not efficient when there are many similar tasks need be conducted. In this post, I present a way to read shape figure of PowerPoint into R, so we can do some reproducible task.
The routine to read shape figure into R is simple: draw some shapes in a slide -> group all shapes -> save pictures as wmf format -> convert wmf format into svg format -> take svg format figure as XML and parse all object into a list, then we can hand the figure as polygons/polylines/points in R.
Step 1: draw some shapes in a slide and save them as a wmf picture.

Note, before save the shapes as wmf figure, you need to vertically flip the shapes first!
Step 2: Convert the wmf figure into svg format.
There are many tools can do the converting task. I recommend two:
After converting into svg format, we can view the figure in web-browser. Note, some parts of the figure could be lost, so do check first!
Step 3: take the figure as a XML file and read it into R
Here is the code to extract the shapes into a list object of R:
library(XML)
paths <- xmlRoot(xmlTreeParse("Picture2.wmf.svg"))
shapes <- sapply(xmlApply(paths[[1]], xmlAttrs),"[[", 2)

SPs <- lapply(shapes, FUN = function(x) {
  tmp <- gsub("[[:alpha:]]", "", x)
  tmp <- strsplit(gsub("^ *| *$", "", tmp), " +")[[1]]
  tmp <- as.data.frame(t(matrix(as.numeric(tmp), nrow  = 2)))
  names(tmp) <- c("x", "y")
  row.names(tmp) <- NULL
  tmp
  })

length(SPs)

xlim <- range(sapply(SPs, "[[", 1))
ylim <- range(sapply(SPs, "[[", 2))

plot(0,0, xlim = xlim, ylim = ylim)

for(i in 1:length(SPs)){
  sp <- SPs[[i]]
  polygon(as.numeric(sp$x), as.numeric(sp$y), col = "grey")
  text( mean(sp$x), mean(sp$y), i)
}
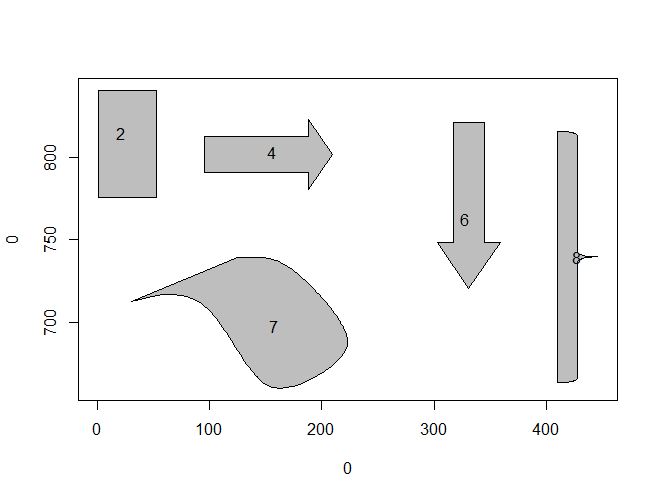
Maybe you have find some parts are not and should not be draw as polygons, but that’s and easy issue to fix, right?